Over the past few weeks I’ve been extending some work I did a few months back pouring through the historical weather and climate records in the Alberni Valley. Since, according to the latest IPCC report1 warming of the climate is now deemed ‘unequivocal’ and the change ‘unprecedented’ since the 1950s, and further, that ‘human influence on the climate is clear’, then I wanted to see what climate change has meant here in the Alberni Valley. Has the Alberni Valley warmed? How have weather patterns changed? I hope to provide one glimpse of that information here.
Weather and Climate
Right off the top I think it important to point out the differences between these two key terms. Here are the Encyclopedia Britannica definitions2:
Weather: “state of the atmosphere at a particular place during a short period of time”
vs.
Climate: “conditions of the atmosphere at a particular location over a long period of time”

The best example of this difference is the current temperature and statistics you see at the top of the webpage. This is the weather. But dive into the Weekly, Monthly, Yearly or All Time Almanacs, and you start getting into the climate as reported by this station.
Also note, I am not a climate scientist, nor am I a meteorologist. I am a layman and this treatment should be viewed in layman’s terms. I’ve done my best to present it as accurately and completely as I can. If you see any issues with this post, please do join the discussion in the comments.
Raw Data
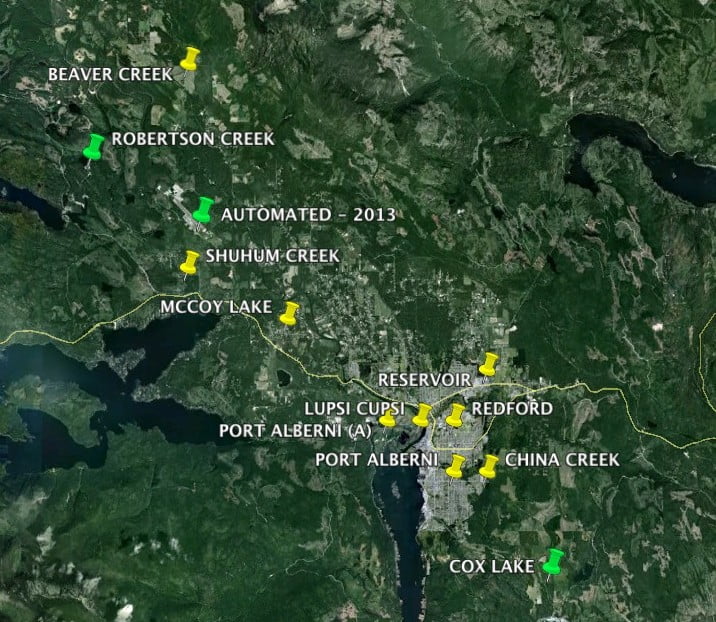
As you can see to the left, Alberni Valley has had many official weather stations over the years, but of course not all at the same time.
Thanks to these stations, Environment Canada has weather records spanning over 100 years from stations generally either near the mouth of the Alberni Inlet, or in the Beaver Creek or Sproat Lake areas. You can browse or download the raw records used to create this section from Environment Canada’s Climate Data website3 . You can also download the consolidated weather records I have used in one (very large) Excel Spreadsheet.
With the caveat that there will be slight differences in climate and weather patterns from stations in the City and those in the Valley, 5 of those stations together will give us a solid record from today back to 1894. This record comprises 41,608 daily records.
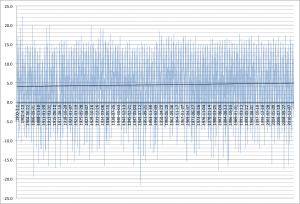
Below from left to right are the charts for Maximum, Mininum and Average temperatures from 1900 to 2012 using Beaver Creek, Port Alberni City, Robertson Creek, Port Alberni A (Somass) and the Automated Alberni Airport stations.
Click for larger images.


The graphs are a mess. Raw data is always this way. But we can see the “climate” out of these “weather” observations. Maximum temperatures are between -10°C and 40°C with an average around 15°C. Minimum temperatures are between -15°C and 28°C with an average around 5°C. The overall median average is just under 10°C.
We can also start to see trends in this raw data, denoted by the solid black line, which is a mathematical calculation of the average. The maximum trend line is declining about 1°C since 1900. Minimums, however, are rising by very near the same amount. If we look at the mean temperature, however, we see something a little more dramatic.
We can draw some lines over the data that bring out the trends, or lack thereof. The bottom dashed line shows there does not seem to be a discernible rise in low daily averages. The same can be said for the first half of the top values. However, there is a drop, and then noticeable rise in top temperatures starting about 1973 and continuing today. So taken as a whole one could very convincingly say that from a preliminary and rough view of the data from differing stations there has been no discernible rise in average or maximum temperatures over the full length of the record. There is a small (~0.2°C) decrease in overall average temperatures and larger decrease in maximums but with the caveat that in the past 40 years, which is more than long enough to be considered relating to ‘climate’, the high side of median average temperatures has shown a significant increasing trend that continues today. It also features an observation of 28°C in 2008 (circled). This is the highest daily average temperature in the record. Whether this high daily average trend continues will determine whether the entire record tips in favour of overall warming in the coming years.
Other items of interest, the hottest temperatures in the data is around 40°C occurring in 1909, 1942 and 2008. The coldest temperatures are around -22°C in 1948 or 49. We have not seen temperatures that low since.
All that said, this data has issues because it is not continuous from one station in one location or even using the same equipment. So while consolidating the whole thing into a contiguous dataset is OK and gives us a rough idea, it is not a very accurate or reliable way of determining what the long term trend is.
Environment Canada’s AHCCD
Environment Canada (along with all meteorological agencies and researchers) attempts to address this problem, in part, by producing products under the Adjusted and Homogenized Canadian Climate Data project4.
They note:
This web site provides adjusted and homogenized climate data for many climatological stations in Canada. These data were created for use in climate research including climate change studies. They incorporate a number of adjustments applied to the original station data to address shifts due to changes in instruments and in observing procedures. Sometimes the observations from several stations were joined to generate a long time series.

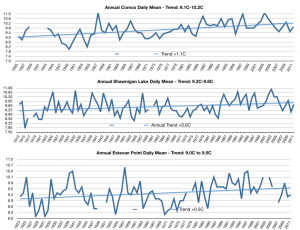
I’ve added the emphasis. This is precisely the type of thing we need done in Port Alberni with our stations. Unfortuantely, Environment Canada has not performed this re-analysis of our local weather records, so we do not have the benefit of having a contiguous record. The nearest stations to ours that have been re-analyzed are Comox Airport, Estevan Point lighthouse (near Tofino) and Shawnigan Lake. Check them out on the left (Click for Larger). The results are pretty clear for the Annual Average temperatures (click for larger):
Check out the Maximum and Minimum as well. The minimum at Comox shows a rise of a full 2.0°C!
But really.. what we want is Port Alberni, not other places on the Island.
A More Complete Approach for Port Alberni: Climate Periods
Raw data is ugly, error prone, and in this case only covers temperature (precipitation records are there, I just haven’t gone through them all!). There is a slightly easier way that avoids station differences.
The Climate Normals5 website delivers the “Normal” climate values for a station in 30 year periods. Environment Canada has normals starting with the 1961-1990 period and they are updated every decade for the previous 30 years. They are the most authoritative, official and complete set of ‘climate’ values produced. Indeed, they are used on an almost daily basis to compare the days weather to what we all expect.

In Port Alberni, the first “normal” climate period was released for 1961-1990 for two stations, the Robertson Creek Fish Hatchery and the Port Alberni “A” station on the Somass river. These normals have been updated twice, 1971-2000 and 1981-2010. By comparing the changes in these periods, we can get a much more complete picture of the changes that have occurred between 1960 and 2010.
To the left is an image of the climate normals website. Below is a list of the climate normal resources. Note the most recent 1981-2010 period has not yet been produced in web format, so I have transcribed the data provided by Environment Canada into downloadeable PDF instead.
Climate changes
In these records, I found the difference between the period of 1961-1990 and 1971-2000. Then I found the difference between 1971-2000 and 1981-2010 and finally the total difference between the 1961-1990 and 1981-2010 periods.
Download the full chart of differences for both stations here.
What do we find?
Temperatures:
#1: Both station’s show significant general warming of between 0.4°C and 0.8°C for maximum, minimum, and average temperatures on a yearly basis.
#2: The largest temperature change for both stations has come in January where minimum temperatures have risen 1.11°C and 1.46°C for the Somass and Robertson Creek stations respectively.
#3: The Robertson Creek station has no month where a decrease in temperature is registered for the full 1961-1990 vs. 1981-2010 comparison. Somass station registered a decrease in 2 of 36 full comparison values, -0.05°C for September minimums and -0.24°C for December maximums.
#4: Only 13 of all 216 monthly temperature values compared show a decrease.
Rain and Snow:
#1: There are significant and dramatic decreases in snowfall of between 40 and 58 centimetres (15-20 inches) a year for each station (34% and 42% respectively).
#2: The Robertson Creek and Somass stations show marked increases in rainfall of between 63 and 94 millimetres a year (3.6% and 4.7%) respectively .
#3: Even though snowfall has decreased dramatically, total precipitation has increased between 21 and 37 millimetres.
#4: Correlating with the increase in minimum January temperatures, January features the greatest decrease in snowfall for both stations.
#5: March and September show the greatest decreases in rainfall whereas January and April show the largest increases (over 57mm in January).
Other items of interest:
#1: Robertson Creek, perhaps due to its “Valley” location has seen more change in its climate than the City and Inlet area which may be more influenced and moderated by the Pacific Ocean.
#2: In general, the differences between the later 1971-2000 period and 1981-2010 are more notable and larger than the 1961-1990 vs. 1971-2000 periods.
#3: If split over the 50 years, the average temperature change per decade would be between 0.18°C and 0.08°C which produces an overall average rise of 0.13°C per decade.
#4: There does not appear to be a urban development related “heat island” effect noticeable as the greater increase in temperature actually occurs at the still rural Robertson Creek hatchery station.
#5: In general, minimum temperatures are higher at the Somass station than Robertson Creek, likely due to the moderating effect of Inlet winds. Rainfall is greater at Robertson Creek.
In Conclusion:
There can be no doubt from this data that our climate in the City of Port Alberni and Alberni Valley has changed, and continues to change. The overall rise of between 0.4°C and 0.8°C in total and 0.13°C per decade compares closely to world trends of between 0.49°C and 0.89°C and 0.12°C per decade as indicated by the latest IPCC report6. Increases in precipitation also agree with IPCC findings of a “likely overall increase in precipitation” in mid-latitude Northern Hemisphere regions after 1950. Given the strong correlations between global IPCC and local observations the resultant link to industrial CO2 emissions is equally strong.
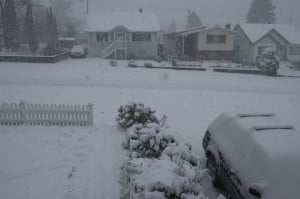
In terms of impact on the local landscape and human expectation, I believe the change in snowfall and rainfall is most important to this point. We have gone from an area known to host large snowfalls at times, to one that shares a rare snowfall like other regions of southern Vancouver Island and the Lower Mainland. This is a sea-level observation but may have implications for snowpack and with what appears to be a drying trend in the early fall may have a serious impact on local salmon runs. In the future, as sea-level snowfall approaches zero and temperatures continue to rise, extremes in summer temperatures and higher lows in winter temperatures will be the more noticeable trend.
Finally, note that the Port Alberni “A” station on the Somass river was discontinued in 1995. This leaves only the Robertson Creek hatchery station as the definitive long term station of record for the Alberni Valley. The new Automated Airport Station will only have a ‘climate normal’ period published starting for the 1990-2020 period. It is very important that the Robertson Creek station remains functional to continue to have a directly comparable and long term record for our area.
I hope you have found this report of interest. Please share your thoughts in the comments, or send me an email (chrisale@gmail.com). My intent is not for this report to be definitive, as I do not have the credentials or experience to make it so. That said, it is public and all are welcome to refer to it in context so long as it is properly attributed.
Sincerely,
Chris Alemany
Port Alberni, BC
November 11, 2013
References:
1IPCC AR5 wG1 Headlines
2Encyclopedia Brittanica Online
3Environment Canada Climate Data Website
4Adjusted and Homogenized Canadian Climate Data project.
5Climate Normals
6IPCC WGIAR5 Final Draft Chapter 2


Comments
4 responses to “Climate Change in Port Alberni – Snow? What Snow?”
What a fantastic post Chris! It’s great to have all that information collected and presented together – thanks!
Thanks Bill 🙂
Great stuff,and about as calm about it as can be. Nicely documented. Watch it, you’ll be invited to join in the fun and games at IPCC.
I suggest writing a letter to your MP to state your feelings on the Robertson Creek station if you don’t want to lose it as an important station of record. (btw: I’ve heard nothing about it being discontinued.) You could ask for upgrades to that station and better monitoring in the PA valley in general.