Update: Eagle Eyed commenter monty noticed a big error I made in interpretating the graphics below. They are in 100ths of an inch! not mm. Doh!… I have updated, and included appropriate conversions. What the heck is an .05/100ths of an inch anyway?? THe graphics are still pretty… but mixed units? Fail.
It’s always fun to find new weather toys to play with especially when they are very ‘local’.
The best thing I’ve come across recently is the Pacific Northwest Environmental Forecasts and Observations page at the University of Washington. This is an advanced forecast model page that does very fine grained modelling for the PacNW region,
The MMRT model at UWash takes input from the global GFS and NAM models and applies it to a much higher resolution of 36km, 12km, 4km and 1.3km. And since we are in the region, it just happens to cover us as well down to the 4km level.
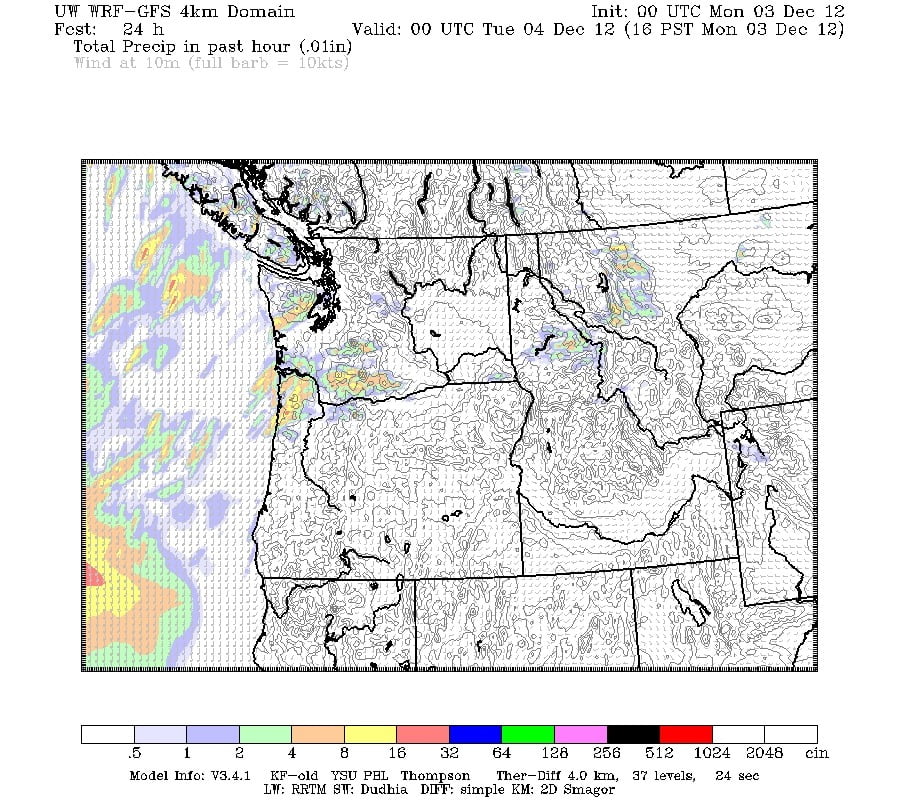
Without further ado, here is the 4km resolution forecast for Mondays rain, this is rainfall over 1 hour periods. The loop of these images is actually kinda beautiful to watch.
At 4PM things are still pretty dry on the Island with a few pockets of showers.
Now we can zoom in and jump to 8PM. The rain should start to get steadier. 0.1inch (2mm)
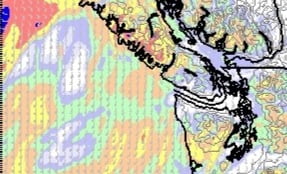
By Midnight we are really getting heavy rain, around 0.2in (5mm) in an hour.
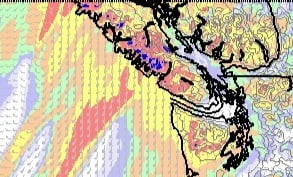
And 2AM tonight looks like the peak intensity with over 0.4in (10mm) falling over the hour.
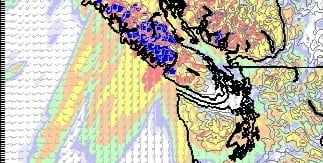
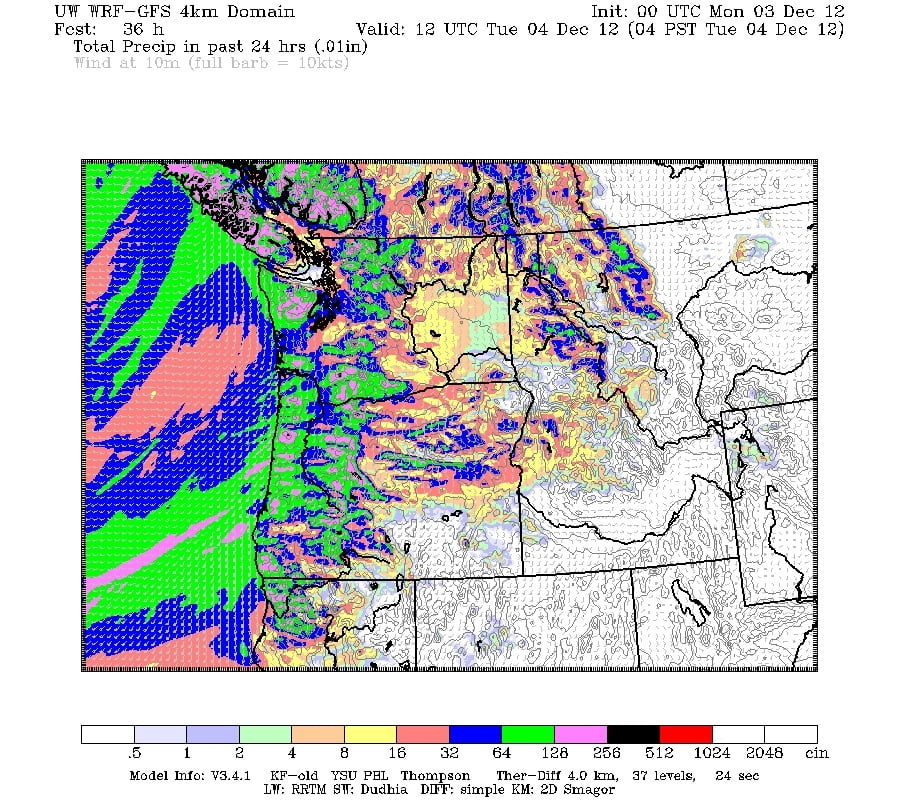
And here is the total precip for the region between 4AM Monday and 4AM Tuesday between 0.6-1in (25mm) is forecast. Look how dry Victoria is compared to Western slopes. The shadow of the Cascades regularly rescues them from the rain.
That’s all for now. Enjoy the peeks of sunshine this morning before the rains come. There will be a little more rain on Wednesday/Thursday before a possible cool down over the weekend. Don’t get too excited at any white possibilities though, its still too early to be really confident.
Oh and I am hopeful that Davis will be completing the upgrades to my station sometime this week and it will be in the mail by Friday. It’s killing me not being able to record all this rain… But such is the way of things….

Comments
6 responses to “Updated: New view of not-so-heavy rains”
I really like those maps, they are really useful when there is snow in the forecast as well. I think you may be miss-reading them however. The colors represent areas of rainfall measured in .01 of an inch. So if you are in the green color that shows .64 to 1.28 of an inch of rain. Or about 16 to 33mm. looks like the peak intensity for Alberni is more likely near 6 or 8 mm per hour. Probably pushing 15mm/hr for the higher west facing mountain slopes to your west.
Thanks monty! Taking the fact that they use C for temps and km for distance, I overlooked the ‘cin’ at the end of the precip bar. Mixed unit system? Fail 🙁 Oh well, still a great system.
Mixed units side (??), these are terrific graphics. Over the last hour here in North Port my temperature has been bouncing around from 5 to 9 and then back again with the wind gusts. I see Nick’s and the schools are doing the same thing.
Yes they are very nice, and proved accurate for this go ’round too. Maquinna got 22mm over the last 24 hours and the Airport got 25mm. So pretty much right on the mark.
I’m keeping an eye on that snow potential for the weekend! Hoping! 🙂
The temperature bouncing around was related to the wall of wind that started through around 5am. Must have been a good gust around 520am when my power went out. Good thing the weather computer and related hardware is on a big battery backup. It’ll run for almost a day before it gets critical.
I live a few blks from you, I have dumped an over filled rain gauge on Mon at noon,
so +200mm, and now since noon yest I already have 45 mm more. :>P
it can stop anytime now !!