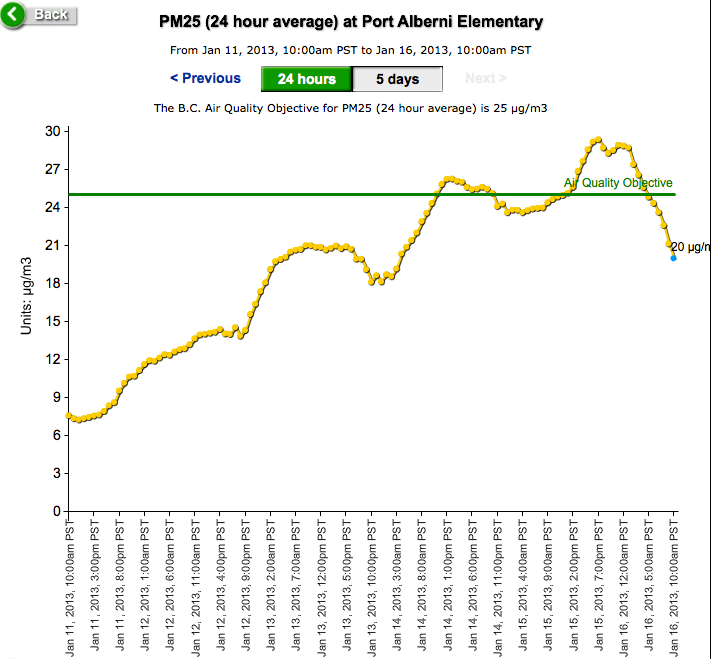
Update 9:44AM: Air Advisory Lifted but risk remains.
“AIR QUALITY ADVISORY ENDED BUT OPEN BURNING RESTRICTIONS CONTINUE FOR ALBERNI VALLEY, WITHIN 15 KM OF PORT ALBERNI CITY HALL”
http://www.bcairquality.ca
The Air Quality Advisory has been lifted, meaning that air quality has improved somewhat locally, but the Province’s and City’s burning restriction remain in force due to a continuation of the current weather pattern.”
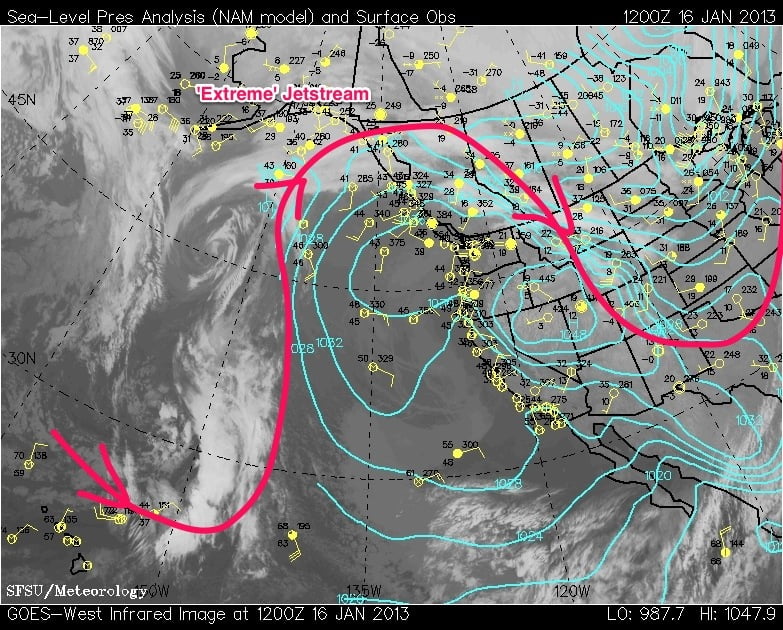
This major ridge of high pressure continues to hold keeping us stuck in an inversion that continues to affect our air quality.
Here is that big bad high pressure:
This is a very strong ridge and, according to Dr. Jeff Masters and others, is an example of a quite extreme Jetstream. This is similar to the pattern that gave us extremely dry conditions in the late summer and fall.
Are they related? Possibly.
From Dr. Masters blog a couple days ago titled, “Extreme jet stream causing record warmth in the east, record cold in the west”
We’ve been seeing an increasing number of situations in fall and in winter in recent years where the jet stream has taken on the sort of extreme configuration that we are seeing today. Dr. Jennifer Francis of Rutgers has published research showing that Arctic sea ice loss may significantly affect the upper-level atmospheric circulation, slowing its winds and increasing its tendency to make contorted high-amplitude loops. High-amplitude loops in the upper level wind pattern (and associated jet stream) increases the probability of persistent weather patterns in the Northern Hemisphere, potentially leading to longer-duration cold spells, snow events, heat waves, flooding events, and drought conditions. Arctic sea ice hit an all-time low during 2012 and remains near record low levels, so it is possible that Arctic sea ice loss contributed to the current extreme jet stream configuration, and the past week’s spate of extreme temperatures on both sides of the U.S.
If true, then as Arctic sea ice declines (and possibly disappears completely in Fall) perhaps we should expect these sorts of periods of inversion s and dry weather to last longer.
This pattern is slated to last at least until Tuesday. Hopefully the air clears up then. Until it does though keep an eye out for dirty wood stoves and open burning in your area and try to keep your burning of wood to a minimum.
And since we are on the topic of Climate Change. It’s January, and that means we have another year under our belt. So what’s the verdict? Well unlike the US which smashed its continental record for hottest year ever, the World didnt quite get there thanks to the cooling effect of La Niña.
Again from Dr. Masters, “2012: Earth’s 10th warmest year on record, and warmest with a La Niña”
Since La Niñas and El Niños are arguably the agents of greatest ‘natural variability’ globally and also affect us in BC in particular I will highlight this part, bold added by me.
The year 2012 was the warmest year on record when a La Niña event was present, surpassing the previous record set just the year before, in 2011. Global temperatures were 0.09°C (0.16°F) cooler than the record warmest year for the planet (2010), and 2012 would very likely have been the warmest on record had an El Niño event been present instead of a La Niña, as seen by looking at the year-to-date global temperature plot for 2012.
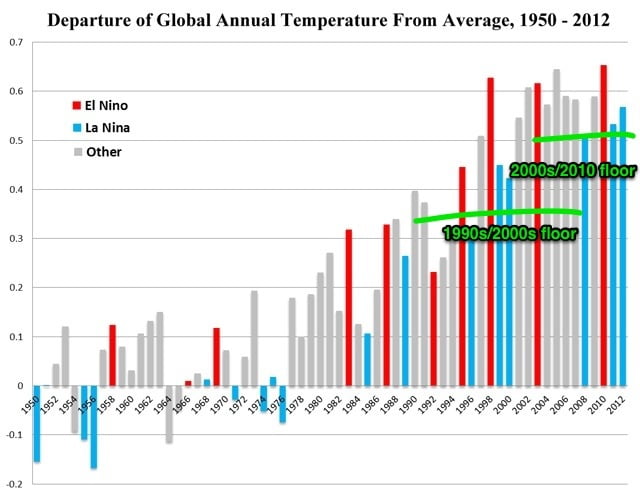
This graph says it all and more:
The march continues upward. Anyone who denies this either has serious eyesight issues, or is simply not accepting the facts. With the ‘floor’ so high now compared to 1998, a return of strong El Niño conditions will be nearly guaranteed to not only set, but smash, global average temperature records.
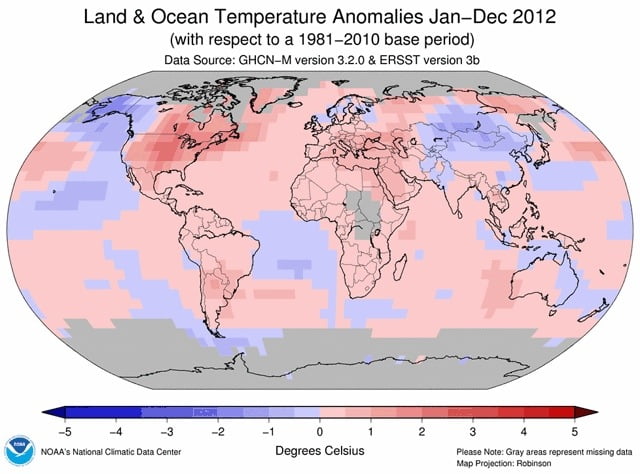
Here is the worlds temperature anomaly map for 2012. As you can see, we here on the West Coast, thanks to a negative PDO bringing us a cool Pacific plus a cool La Niña, were the exceptions to what happened across the globe. Thankfully the current analysis reports neutral or weak La Nina conditions will stick with us well into Spring.


